Eğitim
How to Create a Pivot Table in Excel (Step-by-Step Guide)
Pivot Tables are powerful tools in Excel for summarizing, analyzing, and reporting large datasets. In today’s business world, they help you make smarter, data-driven decisions with ease.
Step 1: Prepare Your Data
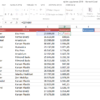
Before starting, make sure your data is clean and organized. Each column should have a clear header (like “Date”, “Product Name”, “Sales Amount”, or “Region”). Avoid blank rows or columns. Every row should represent a single record.
Step 2: Select Your Data Range
Click on any cell within the data range you want to analyze. Excel will automatically select the entire dataset if it’s continuous.
Step 3: Use the Pivot Table Command
Go to the Insert tab in the Excel ribbon.
Click on the PivotTable button.
Step 4: Create PivotTable Window
A dialog box titled “Create PivotTable” will appear.
Make sure the selected table or range is correct.
Choose where to place your Pivot Table — usually, “New Worksheet” is the best option.
Click OK to create your Pivot Table.
Step 5: Build Your Pivot Table
You’ll see a blank Pivot Table area and a panel called PivotTable Fields on the right.
Drag your fields into the appropriate areas:
- Filters: To filter overall data
- Columns: To display data as column headers
- Rows: To display data as row labels
- Values: To summarize numbers (sum, count, average, etc.)
That’s it! You now have a functioning Pivot Table that you can adjust and explore as needed.
Learn More with These Video Lessons on Vidoport
Want to master Pivot Tables? Here are some helpful lessons from Vidoport:
- Creating Pivot Tables and Charts
Video: https://vidoport.com/a-dan-z-ye-excel-de-pivot-tablolar/ozet-tablo-olusturma-ve-grafikler-olusturmak
Course: Excel 2013 – Pivot Tables
https://vidoport.com/a-dan-z-ye-excel-de-pivot-tablolar - Introduction to Pivot Table Training
Video: https://vidoport.com/excel-pivot-tablo-olusturma/pivot-tablo-egitimlerine-giris
Course: Excel Pivot Table and Details
https://vidoport.com/excel-pivot-tablo-olusturma - 5 Rules for Creating Pivot Tables
Video: https://vidoport.com/excel-pivot-tablo-olusturma/pivot-tablo-olusturmada-5-kural
Course: Excel Pivot Table and Details
https://vidoport.com/excel-pivot-tablo-olusturma - Key Points to Keep in Mind When Creating Pivot Tables
Video: https://vidoport.com/excel-pivot-tablo-olusturma/pivot-tablo-olustururken-dikkat-edilmesi-gerekenler
Course: Excel Pivot Table and Details
https://vidoport.com/excel-pivot-tablo-olusturma
Expert Tip
If your data comes from multiple sources, needs cleaning, or needs to be merged, try using Power Query in Excel. Power Query lets you clean, reshape, and combine data before building your Pivot Table. This makes your reporting cleaner and your analysis more flexible.
Ready to Master Pivot Tables?
Start learning with expert-led Excel courses on Vidoport. Whether you’re a beginner or an experienced user, you’ll find step-by-step guidance, real-world examples, and powerful tips to take your reporting to the next level.
👉 Explore Pivot Table Courses on Vidoport
🙋♂️ Frequently Asked Questions (FAQ)
What if my data changes after creating the Pivot Table?
You don’t need to recreate the table. Just right-click the Pivot Table and choose Refresh to update it with the new data.
Can I build Pivot Tables from multiple data sources?
Yes, using Power Query or Excel’s Data Model feature, you can merge tables and create Pivot Tables from complex datasets.
How can I filter my Pivot Table data?
Use the Filters section in the PivotTable Fields pane, or add Slicers for an interactive filtering experience.
Is Power Query too advanced for beginners?
No, Power Query has a beginner-friendly interface with point-and-click tools. It’s a great way to prepare data before using Pivot Tables.
Can I create charts from my Pivot Table?
Absolutely. Go to the Insert tab and select PivotChart to create dynamic visuals based on your Pivot Table.
✍️ About the Author
Ömer Bağcı is a renowned Excel trainer and author with over 10 years of experience helping professionals and companies master Excel, data analysis, and business intelligence. He is the founder of Vidoport.com, an online learning platform offering expert-led Excel, Power BI, and SQL courses. Ömer also shares daily tips, video tutorials, and productivity tools on YouTube, LinkedIn, and through his published books including İleri Düzey Excel 365.
Learn more about his training programs at vidoport.com.